Investing – The Basics

Investing - The Basics

Taxation of Mutual Funds

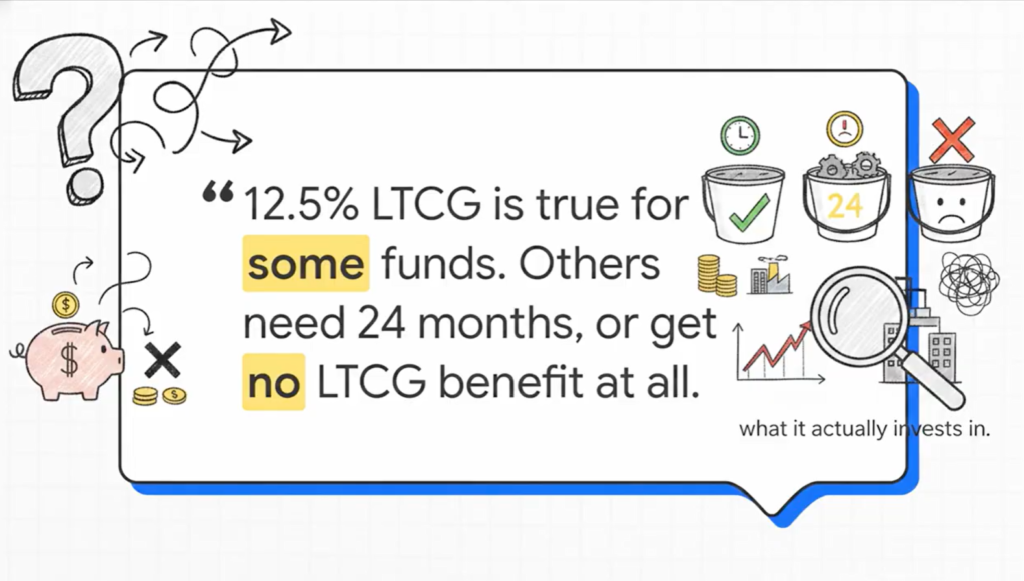
Taxation of Mutual Funds: The Three-Bucket Framework for FY 2025-26 Mutual fund taxation for FY 2025-26 operates as a three-bucket system, determined by what a fund actually invests in. Bucket A — equity-oriented funds (≥65% domestic equity) — use a 12-month holding period, with LTCG at 12.5% above a ₹1.25 lakh annual exemption and STCG at 20%. Bucket B — “Specified Mutual Funds” (debt-oriented, >65% debt/money market) — are always taxed at slab rate as deemed short-term gains, regardless of holding period. Bucket C — everything else, including 35–65% equity hybrid funds and, importantly, Gold/Silver ETFs/FoFs and international FoFs from FY 2025-26 onwards (a recent and favourable reclassification from Bucket B) — use a 24-month holding period with 12.5% LTCG (no exemption threshold) and slab-rate STCG. This guide also covers IDCW taxation as slab-rate income (with the Section 194K TDS threshold recently increased from ₹5,000 to ₹10,000), the FIFO principle’s interaction with SIPs/SWPs/STPs, equity grandfathering, loss set-off rules across buckets, and where to find Capital Gains Statements and CAS for filing.
Investing - The Basics

SIP, SWP & STP

SIP, SWP & STP: Three Tools That Automate When Money Moves SIP, SWP, and STP automate three different directions of money movement in mutual fund investing. A Systematic Investment Plan (SIP) invests a fixed amount at regular intervals — providing rupee-cost averaging and, more importantly, removing emotion-driven timing decisions from the accumulation phase, with step-up SIPs letting growing income translate into growing investments. A Systematic Withdrawal Plan (SWP) is the reverse — the engine behind tax-efficient, self-managed retirement drawdown covered in tackl.finance’s retirement series. A Systematic Transfer Plan (STP) moves money gradually between schemes — commonly used to deploy a lump sum into equity gradually (reducing timing risk) or to implement the equity-to-debt glide path near retirement. This guide explains the FIFO principle governing how each instalment’s holding period is tracked for tax purposes (detailed further in Topic 18), and practical considerations for each tool.

Investing - The Basics

 Choosing a Mutual Fund Scheme

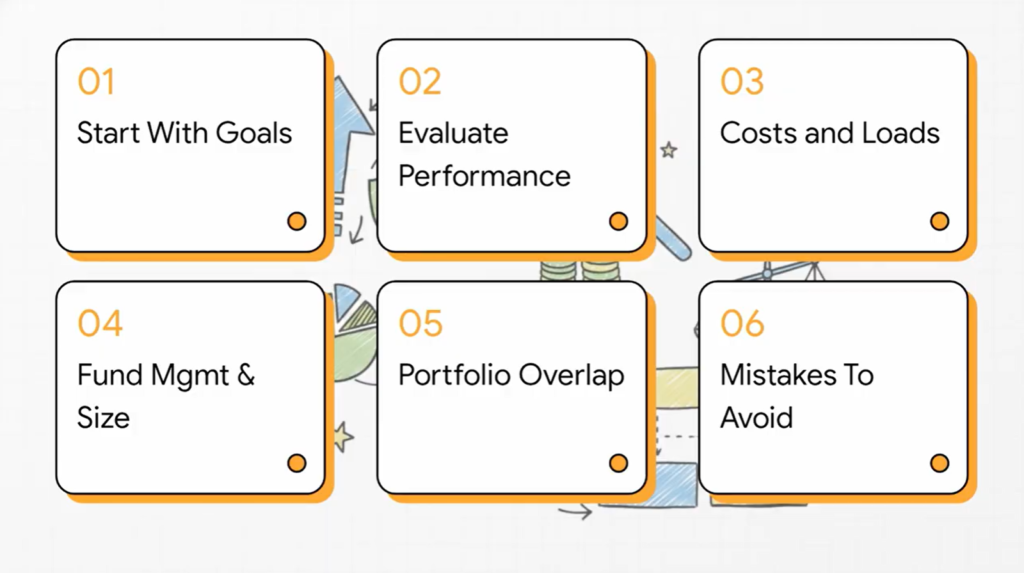
 Choosing a Mutual Fund Scheme With thousands of mutual fund schemes available, this guide provides a repeatable process for choosing among them. It starts with the category decision (driven by your goal’s time horizon, as covered in tackl.finance’s retirement and asset allocation notes) and the SEBI-mandated Riskometer as a sanity check, then covers how to evaluate past performance correctly — rolling returns and consistency across market cycles rather than chasing a single best-year figure, and benchmark comparison for actively managed funds. We cover why the direct-vs-regular cost difference compounds significantly over long horizons, what fund manager tenure and AUM (in both directions) signal, portfolio concentration and cross-fund overlap, a brief introduction to risk-adjusted return metrics (standard deviation and Sharpe ratio), exit loads and ELSS’s genuine 3-year lock-in, and close with the most common mistakes — chasing last year’s winner, over-diversification through overlap, ignoring direct plans, and skipping periodic review.

Investing - The Basics

Advantages & Disadvantages of Real Estate as an Asset Class

Advantages & Disadvantages of Real Estate as an Asset Class Real estate is one of the major asset classes — and the one most Indian households already hold the most of, often without a conscious allocation decision. This guide sets out its genuine advantages (dual utility as both investment and home, two return sources via rental income and appreciation, accessible home-loan leverage, and some long-horizon inflation linkage) against its less-discussed disadvantages: illiquidity and high round-trip transaction costs, high ticket size creating concentration by default, hyper-local/location-specific risk (unlike a diversified index), ongoing costs and vacancy risk, title/legal complexity even with RERA, opaque valuation versus real-time market pricing, and the tax complexities covered in tackl.finance’s tax series (capital gains grandfathering, TDS on purchase). We close with REITs as a partial alternative — addressing liquidity, ticket size, and diversification, while not replacing the dual-utility, leverage, or tax benefits that come specifically with owning a home.

Investing - The Basics

Equities And Bonds

Equities & Bonds: A Comparison Equity and bonds represent opposite relationships with a business — ownership versus lending — and that single difference explains nearly every other contrast between them. This guide compares the two across risk and return (equity’s higher long-term return as compensation for higher volatility and lower priority in liquidation), income certainty (discretionary dividends vs contractual coupons), what drives their prices (earnings/sentiment for equity vs interest rates/credit quality for bonds), inflation sensitivity, the diversification benefit between them (and the important caveat that they can decline together during sharp rate increases), liquidity, and a side-by-side recap of current taxation for each. The conclusion isn’t “equity or bonds” — it’s that both play complementary roles in a portfolio, which is exactly what the asset allocation and retirement-income frameworks covered elsewhere in tackl.finance’s series are designed to balance.

Investing - The Basics

Risks in Direct Equity Investing

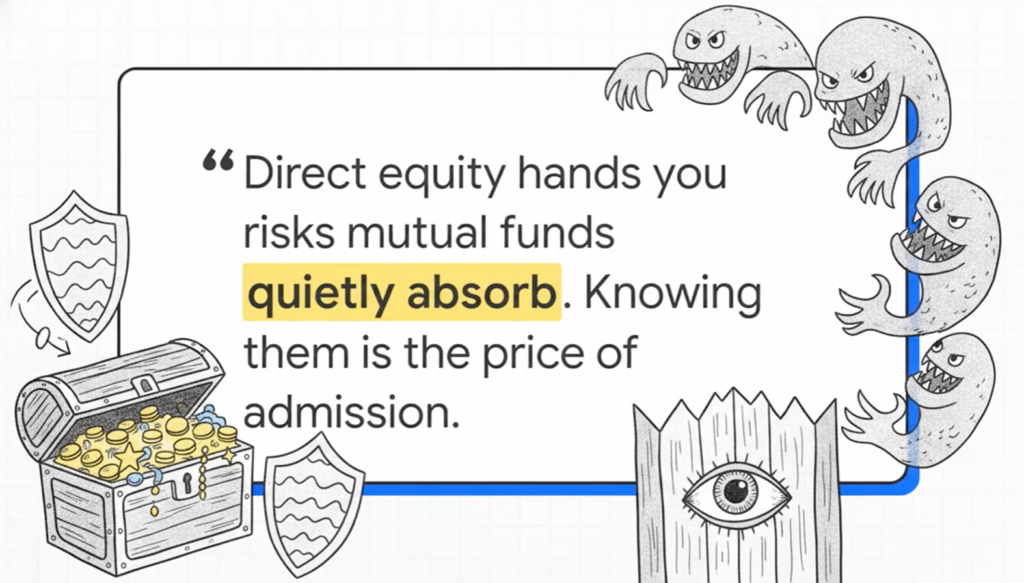
Risks in Direct Equity Investing Direct equity — buying individual stocks yourself — offers control and differentiated return potential, but transfers a number of risks onto the investor that a diversified mutual fund would otherwise spread out or manage. This guide catalogues those risks: systematic/market risk (which diversification can’t solve, but asset allocation across asset classes can help with), unsystematic/company-specific risk (which concentration in a small number of holdings amplifies), liquidity risk (especially in smaller stocks), sector concentration hiding behind a seemingly-diversified stock count, information asymmetry, behavioural risks (herd mentality, loss aversion, overconfidence), corporate governance risk, optional leverage risk (margin/F&O), and the often-overlooked time and expertise commitment direct equity genuinely requires. We close with practical mitigants — position sizing, sector-level diversification checks, staying within your “circle of competence,” and a “core and explore” approach combining index/mutual funds with a smaller direct equity portion.

Investing - The Basics

Technical Analysis: An Overview

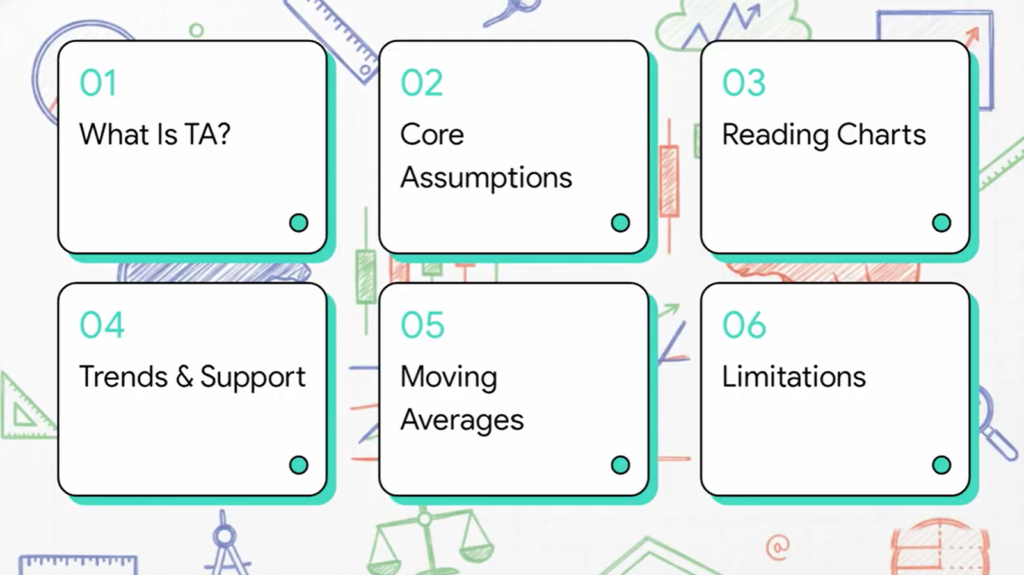
Technical Analysis: An Overview Technical analysis studies price and volume charts to identify patterns that may help anticipate future price movements — based on the premise that price reflects all available information, that trends tend to persist, and that crowd psychology (and therefore price patterns) tends to repeat. This guide covers how to read candlestick charts and volume, the concepts of trends, support, and resistance, moving averages (SMA vs EMA, and crossover signals like the “golden cross”), and a brief glossary of common indicators (RSI, MACD, Bollinger Bands) and chart patterns. We contrast TA’s “when to buy/sell” focus with fundamental analysis’s “what to buy” focus, and close with TA’s honest limitations — subjectivity, its lagging nature, the ongoing Efficient Market Hypothesis debate about whether price patterns can reliably predict the future at all, and its inability to anticipate sudden fundamental shocks.

Investing - The Basics

Fundamental Analysis: An Overview

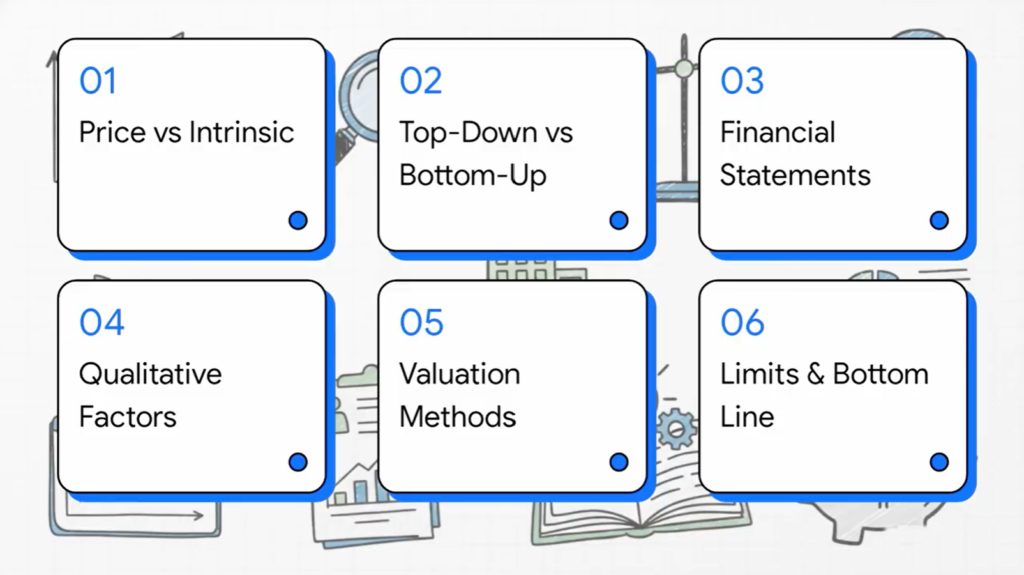
Fundamental Analysis: An Overview Fundamental analysis is the process of estimating what a company is actually worth (its “intrinsic value”) and comparing that to its current market price — on the premise that the two can diverge in the short term but tend to converge over time. This guide covers top-down vs bottom-up approaches, what each of the three financial statements (Income Statement, Balance Sheet, Cash Flow Statement) reveals and why all three matter together, the qualitative factors numbers can’t capture (competitive moat, management quality, governance, industry dynamics), the two broad valuation approaches (relative valuation using multiples, and Discounted Cash Flow), where to actually find this information (annual reports, investor presentations, earnings calls, exchange filings), and the honest limitations — it’s time-consuming, doesn’t help with timing, and is highly assumption-dependent.

Investing - The Basics

Key Financial Terms for Equity Investing

Key Financial Terms for Equity Investing This guide is a working glossary of the financial terms that appear on every stock research page — explained as questions each one answers, not just formulas. It covers Market Capitalisation (and the large/mid/small-cap ranking convention), EPS (basic vs diluted), the P/E ratio (trailing vs forward, and why it’s only meaningful in comparison), the P/B ratio (most useful for asset-heavy businesses), ROE and ROCE (and why looking at both together matters more than either alone), the Debt-to-Equity ratio (and why “normal” varies by industry), Revenue/margins/Free Cash Flow, and 52-week high/low and Beta. The closing message: no single metric answers “is this a good investment?” — the real skill is noticing what each number doesn’t tell you, and checking the metric that fills that gap.

Investing - The Basics

How Stock Exchanges Work

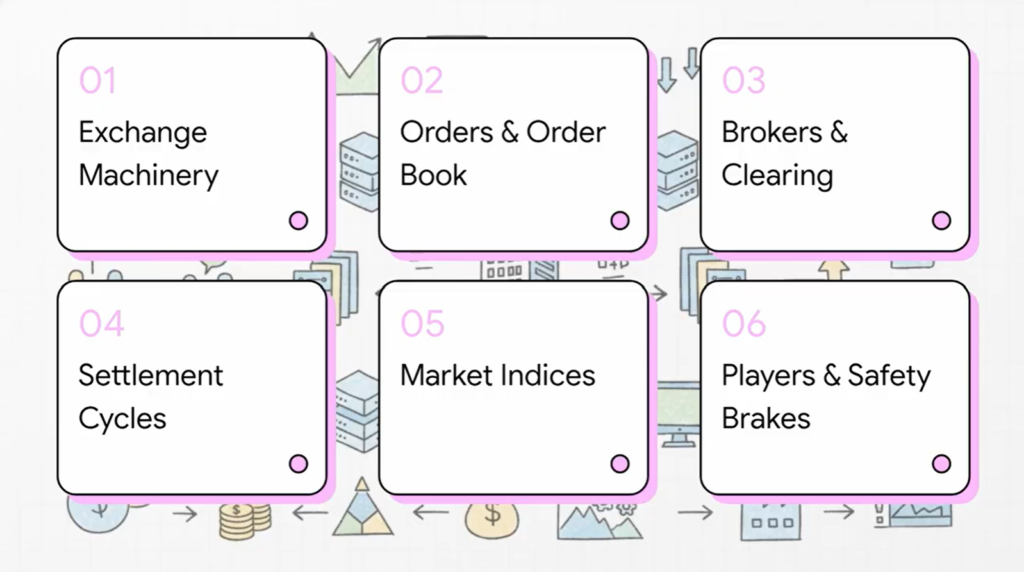
How Stock Exchanges Work: The Machinery Behind Every Buy and Sell Order Behind every ‘buy’ tap on a trading app is an infrastructure of exchanges, depositories, and clearing corporations working together. This guide explains how NSE and BSE match buy and sell orders (market, limit, and stop-loss orders, matched via price-time priority), the role of your broker, Demat accounts held with NSDL or CDSL, and clearing corporations that guarantee every trade. It covers India’s settlement journey — from T+2 to T+1 (January 2023) to the now-expanding optional T+0 same-day settlement (available for a substantial number of stocks by 2026) — how benchmark indices like the Sensex and Nifty 50 are constructed using free-float market capitalisation, the circuit breakers that pause trading during extreme volatility (both stock-specific and market-wide), the structure of the trading day, and SEBI’s role as the regulator tying every part of this system together.

Book an Appointment Form